
2027 NFL Draft Tight End Rankings - 37-41
| # | Player | Pos | H/W/S | Team | Weight | Height | 40YD | AVG POS RANK | AVG OVR RANK | Rating | Summary |
|---|---|---|---|---|---|---|---|---|---|---|---|
20 |

|
6-5
259lbs
4.71
|
TE |

|
259lbs | 6-5 | 4.71 | 18 | 313 |
74.0
|
Masunas is a reliable, blocking-first tight end who has earned his coaches' trust at Texas. He handles his assignments in the run game and... |
11 |

|
6-6
260lbs
4.65
|
TE |

|
260lbs | 6-6 | 4.65 | 16 | 297 |
80.2
|
Foley is a 6-6, 260-pound target who broke out at Tulsa in 2025 with seven touchdowns and first-team all-conference honors, a big red-zone... |
5 |

|
6-6
265lbs
4.65
|
TE |

|
265lbs | 6-6 | 4.65 | 10 | 147.3 |
83.7
|
Clarke is an athletic, productive tight end whose journey from London to Temple's record book is one of the most unusual in the class. He... |
40 |
|
6-5
270lbs
4.80
|
TE |

|
270lbs | 6-5 | 4.80 | 48 | 708 |
60.2
|
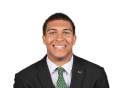
The 2025 season lasted two games, one catch and a torn labrum. Williams arrived at Oregon State by way of Miami, where he signed as a... |
13 |

|
6-6
275lbs
4.78
|
TE |

|
275lbs | 6-6 | 4.78 | 12 | 217.5 |
79.0
|
Honig is a big, athletic tight end with a quarterback's feel for coverage. He finds space on seam and crossing routes, catches what is... |