Kansas City is 4-0 and has lost Rashee Rice for several weeks, and our model has the Chiefs at twelve wins with the title odds trimmed to four percent
Updated
Kansas City went to Las Vegas and won 30-27, its fourth straight win to open the season and the second of the four decided by a single score. The Chiefs are 4-0 and sit atop the AFC West by a game over the Raiders. When we ran the rest of the season Kansas City came out at 12-5 with a 95.5 percent playoff chance and a four percent title chance. The record projection is unchanged from a week ago and three and a half wins above the 8.4 the summer sim had for the Chiefs. The title odds have slipped from ten percent to four, and that movement is worth a sentence: Jacksonville and Baltimore have both climbed sharply in the same simulations, and the Chiefs' defense gave up 27 to a Raiders offense the model does not rate highly. The Chiefs are still the model's most likely AFC West champion by a wide margin. They are no longer its most likely AFC champion.
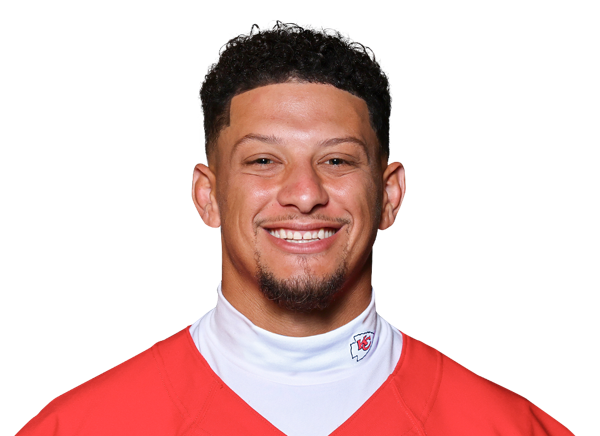
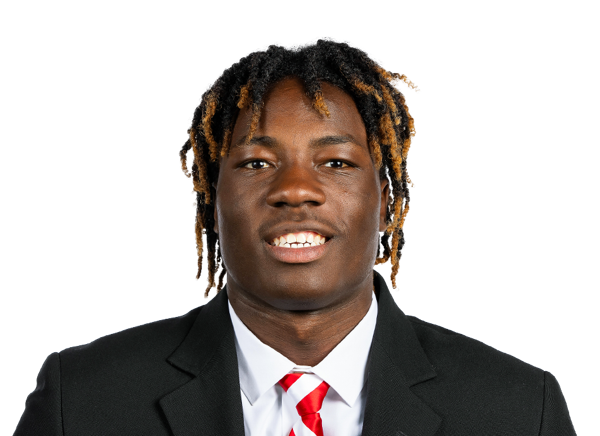
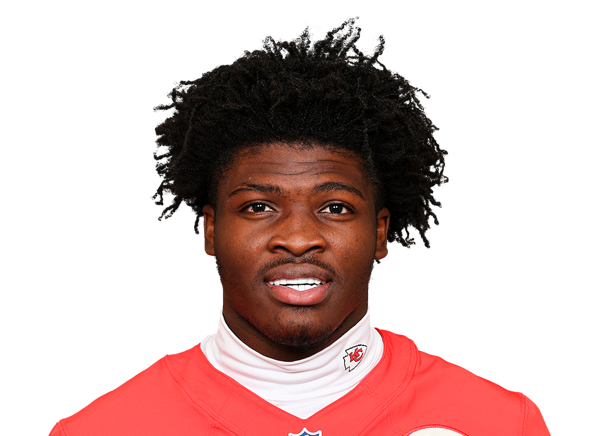
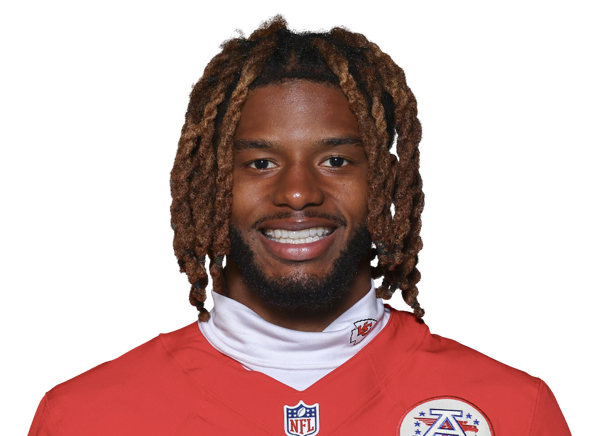
The offense has been the engine, and the running back is the surprise. Kenneth Walker III has 537 rushing yards and four touchdowns on 87 carries, the most rushing yards in the league, and our model projects him for 1,692 yards and 16 scores, which would be the best season of his career by a wide margin. Patrick Mahomes is 82 of 128 for 1,037 yards with nine touchdowns and two interceptions, a 106 rating through four games, and projects for 4,069 yards and 28 touchdowns. Travis Kelce has 16 catches for 246 yards and two scores and projects for 66 catches and eight touchdowns. The receiver room is the concern. Rashee Rice left the Raiders game with a hamstring injury and is reportedly out for several weeks. Tyquan Thornton is expected to have surgery after a hip-drop tackle and will miss three to four months. Xavier Worthy projects for 61 catches and will need to be more than that. The unit projects for 430 points, fourth in the league.
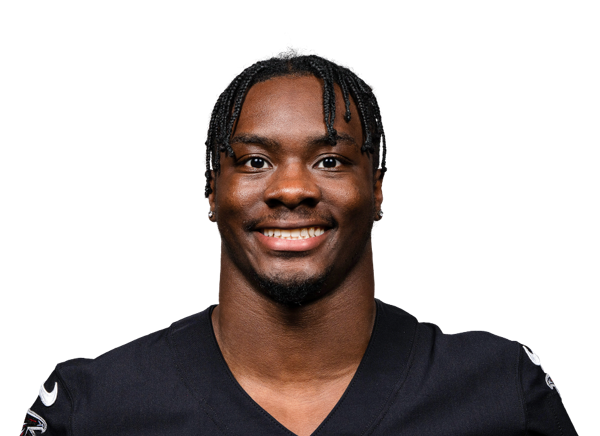
The defense is the reason the title odds moved. Kansas City projects to allow 350 points, 14th in the league, up from 332 a week ago, and the ninth-most yards. The pass rush is the weakest in football by projection. The Chiefs project for 32.6 sacks, last in the league, with Felix Anudike-Uzomah leading at eight and Chris Jones at seven. George Karlaftis projects for five sacks and an interception. The back end has been better than the front. Nick Bolton projects for 124 tackles and Drue Tranquill for 114. Mansoor Delane projects for two picks from the corner spot, and the team projects for over twelve interceptions, tenth. A defense that cannot pressure the quarterback has survived four games because the offense has outscored the problem. Against the Jaguars and Ravens, in January, that is the matchup the model keeps running.
The division is close to decided in the model's view, even with the Raiders at 3-1. Las Vegas projects for nine wins with the head-to-head already lost. Denver is 2-2 and projects for nine. The Chargers are 0-4 and project for six. When we ran the rest of the season Kansas City won the AFC West in the large majority of simulated years, and the Raiders took it in the minority that depended on a Chiefs injury or a second half slide. A 4-0 start with the division's best quarterback and the division's best running back is a lead the model expects to hold.
The next month starts with a bye and then gets interesting. Week 5 off, the Chargers at home at 64 percent, a trip to Seattle at 48, a trip to Denver at 60, and the Jets at home at 68. When we ran that stretch the Chiefs went 3-1 more often than anything else, and the Seattle game is the one the model treats as a loss as often as a win. A 7-1 record entering November would push the projection past 13. A 6-2 record would keep it at twelve, with the Rice injury as the thing that decides which.
The player lines moved less than the title odds did. Mahomes' projection dropped from 4,133 yards to 4,069 with his touchdown line holding at 28 and his rating projection at 101. Walker's rushing projection climbed from 1,550 to 1,692, the biggest move on the roster, with his touchdown line holding at 16. Rice's projection dropped from 96 catches to 86 before the hamstring was fully priced in, and will fall further. Worthy's yardage projection rose from 660 to 716. Kelce's dropped from 69 catches to 66. Emmett Johnson's rushing projection slipped from 244 to 231. On defense, Chris Jones' sack projection fell from 7.8 to seven and Karlaftis' held at 5.3 with his interception line at 1.2. Bolton's tackle projection rose from 118 to 124 while Tranquill's dropped from 121 to 114. Delane's interception line climbed from 1.4 to 1.9. The number to watch is the points allowed. Kansas City projects for 350, up from 332 a week ago, and the gap between that and the 280 and 256 the Rams and Jaguars project for is the whole title conversation. The offense can outscore 350. January is about whether it has to.
The matchup record is a team that has beaten every projection the model put in front of it. We gave Kansas City 34 percent against Denver and the Chiefs won by 21. We gave them 48 against Indianapolis and they won by three. We gave them 80 in Miami and they won by 14. We gave them 70 in Las Vegas and they won by three. Four wins from about two and a third expected is one of the five largest overperformances in the league, and the difference is that the Chiefs have done it with the kind of roster the model now rates among the four best in football. The market opened Kansas City at eleven and a half wins. Our model sat three under it in July and sits a half-win over it now. The lean is the quarterback and the running back. The pass rush, and the receiver room without Rice, are the reasons it is not larger.