Philadelphia lost at home to the Rams and is 2-2 without Barkley, Smith and Goedert, and our model cut the Eagles to nine wins
Updated
Philadelphia lost 24-20 at home to the Rams, its second straight loss after a 2-0 start, and did it without DeVonta Smith, Dallas Goedert and a healthy Saquon Barkley. The Eagles are 2-2, and the model has stopped giving them the benefit of the doubt it gave them in July. When we ran the rest of the season Philadelphia came out at 9-8 with a 46 percent playoff chance and half a percent title chance, down from 10.6 wins and 83 percent after Week 3 and from 11.2 wins and a four percent title shot in the summer. The playoff odds have fallen by more than half in a month, and the injury report is most of the reason.
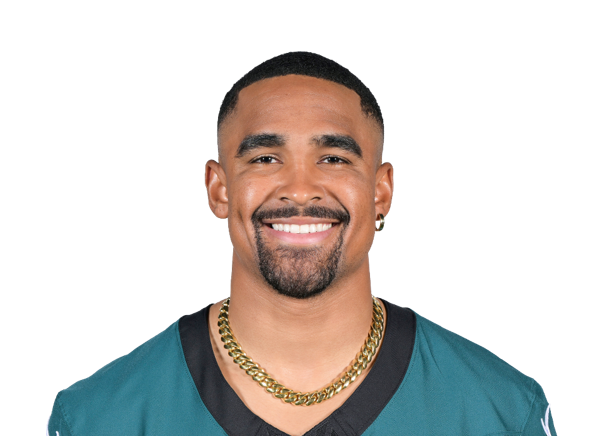
The offense has been the problem and the injuries explain part of it. Jalen Hurts is 68 of 114 for 713 yards with seven touchdowns and three interceptions, an 87 rating through four games, and has been sacked twelve times. Our model projects him for 3,571 yards and 23 touchdowns, down from 3,825 and 25 a week ago, plus 397 yards and five scores on the ground. Saquon Barkley has 182 rushing yards on 36 carries without a touchdown and is week to week with a hamstring. His projection has dropped to 862 yards. Tank Bigsby is on injured reserve after core surgery. Will Shipley's projection has nearly doubled to 280 yards as a result. DeVonta Smith missed the Rams game with a hamstring and projects for 81 catches and 1,122 yards, down from 90 and 1,248. Dallas Goedert has a sprained MCL and will miss multiple weeks. Dontayvion Wicks has 197 yards and projects for 50 catches. The unit projects for 325 points, 23rd in the league, down from 355 and 15th a week ago.
The defense is still the strength and still the reason the Eagles project for nine wins rather than seven. Philadelphia projects to allow 320 points, fifth in the league, and the sixth-fewest yards. Jonathan Greenard projects for 12.6 sacks and Nolan Smith for ten. Jalen Carter for four and a half from the interior. Zack Baun projects for 105 tackles and two interceptions. Jihaad Campbell for 107 stops. Andrew Mukuba's interception projection has more than doubled to over two. The team projects for under 37 sacks, 23rd, which is the one soft number. The unit gave up 27 in Chicago and 24 to the Rams, and both were games the offense scored 20 or fewer. The defense is not what has changed since July. The offense around it has.
The division has moved and the Eagles are no longer at the front of it. Dallas is 2-2 and projects for ten wins. The Giants are 3-1 and project for eight. Washington is 1-3 and projects for four and a half. Philadelphia projects for nine, and when we ran the rest of the season the Eagles won the NFC East in a minority of simulated years, behind Dallas, which is the first time all season the model has had them second. The Cowboys game in Week 7 is at home and the model gives Philadelphia 40 percent in it.
The next month is a mix of the hardest game on the schedule and three of the easiest. A trip to Jacksonville at 24 percent, Carolina at home at 74, Dallas at home at 40, a trip to Washington at 76, and the Giants at home at 78. When we ran that stretch Philadelphia went 3-2 more often than anything else, with the Jacksonville game treated as a loss and the division games against the Commanders and Giants as wins. A 5-4 record entering November would keep nine wins on schedule and the division within reach if the injured players are back by then.
The player lines are an offense being rerun around three injuries. Hurts' projection dropped from 3,825 yards to 3,571 and from 25 touchdowns to 23, with his rating projection down from 97.5 to 92.5. Barkley's rushing projection fell from 935 to 862 and his touchdown line from five to four. Shipley's rushing projection rose from 162 yards to 280. Smith's dropped from 90 catches to 81 and from 1,248 yards to 1,122. Wicks' climbed from 48 catches to 50. Goedert's held at 45 catches and six touchdowns before the MCL was fully priced. Lemon's slipped from 47 catches to 46. On defense, Greenard's sack projection fell from 13.5 to 12.6, Nolan Smith's rose from 8.9 to ten, and Jalen Carter's dropped from 4.9 to 4.4. Baun's tackle projection fell from 117 to 105 and his interception line from 2.5 to 2.1. Campbell's tackle projection dropped from 116 to 107. Mukuba's interception line went from one to 2.3. The number to watch is the points scored. Philadelphia projects for 325, down from 355 a week ago and 388 in July. The defense is still a top-five unit. The offense has fallen out of the top 20, and nine wins is where a top-five defense and a 23rd-ranked offense meet.
The matchup record is a team that has won the games it was supposed to win and lost the ones it was not, with one exception. We gave Philadelphia 86 percent against Washington and the Eagles won by two. We gave them 90 in Tennessee and they won by four. We gave them 60 in Chicago and they lost by 20. We gave them 30 against the Rams and they lost by four. Two wins from about two and two-thirds expected is under the projection, and the two wins were closer than the numbers said they should be. The market opened Philadelphia at eleven and a half wins. Our model sat on it in July and sits two and a half under it now. The gap is the injury report. If Barkley, Smith and Goedert are all back by November, nine wins is a floor. If the absences run long, it is the number.