Seattle Seahawks 2026 Season Preview & Fantasy Outlook Projection, Odds, Predicted Record & Fantasy Football

Seattle Seahawks logo
Seattle Seahawks 2026 Season Projection & Fantasy Outlook
11-6 projected • 2026 Season Projection • NFC W • 8% Super Bowl • 90% Playoffs
← All 32 team previews & the full 2026 league projection

Seattle grades out as a genuine contender on both sides, and our model plants it just above the market

Updated

The Seahawks quietly assembled one of the more balanced rosters in the conference, and our model rewarded them for it. When we ran the simulations, Seattle came out at eleven and a half wins, a touch above a market that already respects them, on the strength of an offense and a defense that both grade in the top six. This is not a flashy projection driven by one superstar. It is the number a genuinely complete team earns, and in a division with the mighty Rams, complete is exactly what Seattle needs to be.

The offense runs through a quarterback having the best stretch of his career. Our model projects Sam Darnold for 3,824 yards and 25 touchdowns with a passer rating near 97, a clean, efficient season from a passer who has found a home. That is not an MVP line, but it does not need to be, because the weapons around him do a lot of the heavy lifting. When we ran the season, Darnold managed games well and made enough plays to keep Seattle's offense humming, which is all this roster asks of him.
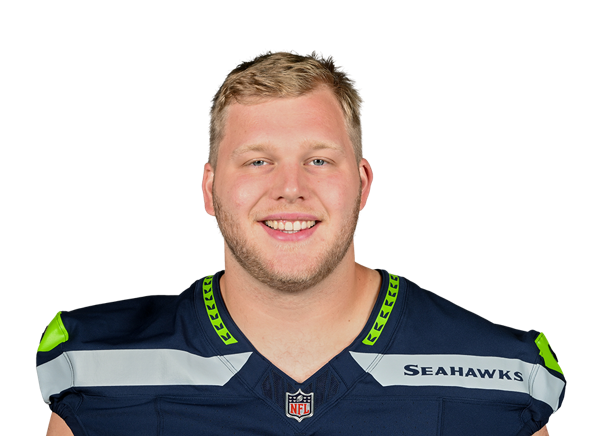
The receiving corps is the strength. Jaxon Smith-Njigba has become a legitimate number one, projected for 82 catches and nearly 1,100 yards, a separator who wins from the slot or outside. Cooper Kupp, added to pair with him, brings 89 catches and over 1,000 yards of savvy veteran production, giving Darnold two reliable targets on every dropback. Rashid Shaheed adds a vertical element and AJ Barner is a red-zone weapon at tight end with 5 scores in our projection. That is a deep, complementary group.

The defense is what makes Seattle a contender rather than just a good offense. Our grade slots the unit sixth in the league, built on a disruptive front. Byron Murphy II is an ascending interior force, Leonard Williams and DeMarcus Lawrence bring proven pass rush, and Uchenna Nwosu adds juice off the edge. When we ran the simulations, Seattle's defense got stops in the moments that decided games, and a top-six unit is the kind of foundation that travels in January. This is a two-way team.

Landing just above the market is the honest read, and it is grade-supported cleanly. Our number sits a fraction over Vegas, well within the range where the model and the market are essentially agreeing, and it rests on grades that put both units among the league's best. This is not a bold disagreement that needs a flag. It is the projection of a very good team that the market has correctly identified as very good, with our model just a hair more optimistic about the ceiling.

The one thing standing between Seattle and the top of the division is the address across the way. The Rams graded out as the best team in football, and Seattle has to face them twice, which caps how high even an eleven-win projection can climb in the NFC West. When we ran the season, the Seahawks handled most of their schedule but split or lost the Rams games, which is the difference between a division title and a strong wild-card berth. Second place in this division is still a very good team.

The balance is the whole appeal. A team that can win with its offense on a Sunday and its defense the next week is a team built for the grind of a long season, and Seattle is exactly that. When we ran the simulations, the Seahawks rarely got blown out because there was always one unit playing well enough to keep them in it. That floor is what pushes the projection above the market, even accounting for the Rams standing in the way of the division crown.

The path to beating our number runs through Darnold's ceiling. If he plays closer to his best form for a full season rather than merely managing games well, the offense climbs from good to dangerous and Seattle pushes toward twelve or thirteen wins and a real shot at the division. A quarterback playing his best behind this supporting cast would be a problem for anyone. That is the upside, and with weapons like these, it is within reach.

The path below it is a Darnold regression. If last year's efficiency proves to be a high point and he slides back toward his earlier career form, the offense leans harder on the defense than a contender should, and eleven wins becomes nine. That is the downside, and it is why our number sits just above the market rather than well above it. The quarterback is the swing variable on an otherwise stable roster.
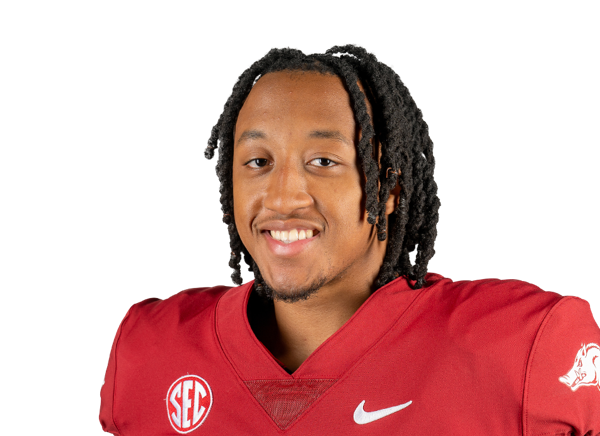
So the read on Seattle is a balanced, two-way contender that grades among the best in the league and lands right where a team this complete should. When we ran the simulations, the Seahawks were a playoff team nearly every time, held back from the division crown only by the extraordinary team sharing their division. Eleven and a half wins is a very good season, and our model sees a very good team. We take the modest over and call Seattle a genuine threat.
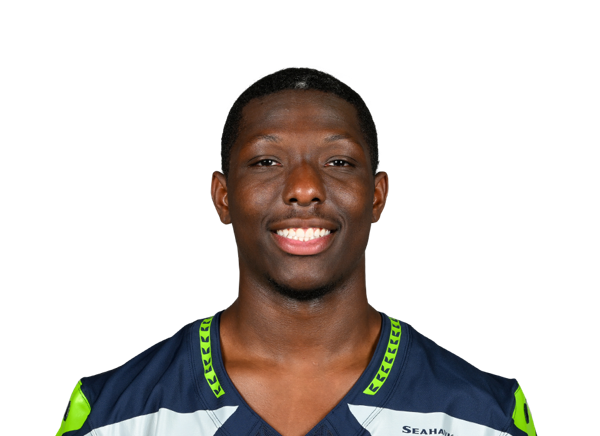
Watch the Rams games, because they define the ceiling. If Seattle can steal one or both, the division is live and this projection could look light. If the Rams sweep the series as our numbers slightly favor, the Seahawks are still an eleven-win wild-card team with the roster to make noise in January. Either way, our model sees one of the better teams in the conference, and the grades on both sides of the ball back it all the way.

Team Stats

Offense
Points / Game 26.2445 total
Total Yards / Game 363.56179 total
Pass Yards / Game 226.665.7% comp%
Rush Yards / Game 136.9556 att
3rd Down % 41.9%88 / 210
Red Zone % 63.1%41 TD / 65 att
Defense
Points Allowed / Game 19.8336 total
Yards Allowed / Game 341.25801 total
Sacks 48.3
Interceptions 16
Forced Fumbles 11
Turnovers & Penalties
Turnovers 2413 INT • 12 FUM
Sacks Allowed 28209 yds lost
Penalties 109933 yds

Player Stats & Fantasy Projections

Seattle Seahawks's projected 2026 fantasy football points for every player. The FPTS column is each player's projected fantasy total — switch between PPR and standard scoring below.

Passing FPTS
321/489, 3824 yds, 25 TD, 11 INT
234.9
25/36, 238 yds, 1 TD, 2 INT
16.4
Rushing FPTS
291 car, 1281 yds, 13 TD
248.1
Jadarian Price HB
97 car, 587 yds, 4 TD
84.4
71 car, 227 yds, 2 TD
65.0
22 car, 99 yds, 0 TD
16.8
30 car, 78 yds, 1 TD
26.7
9 car, 28 yds, 0 TD
5.9
21 car, 19 yds, 2 TD
234.9
16 car, 9 yds, 1 TD
16.4
Receiving FPTS
82/127, 1097 yds, 6 TD
227.7
89/134, 1053 yds, 6 TD
230.3
43/68, 574 yds, 3 TD
130.4
42/61, 447 yds, 5 TD
116.7
20/32, 248 yds, 1 TD
50.8
22/29, 200 yds, 1 TD
248.1
Emmanuel Henderson Jr. WR
10/16, 129 yds, 1 TD
28.9
14/18, 123 yds, 1 TD
65.0
7/9, 59 yds, 0 TD
26.7
4/5, 29 yds, 0 TD
16.8
Rashad Rochelle WR
2/4, 29 yds, 0 TD
4.9
Jadarian Price HB
2/3, 17 yds, 0 TD
84.4
1/2, 13 yds, 0 TD
2.3
2/2, 11 yds, 0 TD
5.9
Lance Mason TE
1/2, 10 yds, 0 TD
2.0
Tyrone Broden WR
0/1, 6 yds, 0 TD
0.6
Montorie Foster Jr. WR
0/1, 4 yds, 0 TD
0.4
Defense FPTS
137 tk, 0.2 sk, 2 prss, 5 INT, 1 FF
149.9
124 tk, 0.7 sk, 6 prss, 0 INT, 1 FF
123.5
111 tk, 1.3 sk, 11 prss, 1 INT, 1 FF
111.7
109 tk, 0.2 sk, 1 prss, 3 INT, 1 FF
116.4
106 tk, 0.3 sk, 2 prss, 0 INT, 1 FF
107.5
63 tk, 0.3 sk, 2 prss, 2 INT, 1 FF
85.6
62 tk, 0.1 sk, 0 prss, 1 INT, 1 FF
65.2
Julian Neal CB
38 tk, 0.1 sk, 0 prss, 0 INT, 0 FF
37.6
36 tk, 7.3 sk, 55 prss, 0 INT, 1 FF
87.7
35 tk, 0.6 sk, 5 prss, 0 INT, 0 FF
33.3
31 tk, 10.7 sk, 49 prss, 0 INT, 0 FF
73.4
29 tk, 4.4 sk, 23 prss, 0 INT, 0 FF
43.3
29 tk, 11.4 sk, 88 prss, 0 INT, 1 FF
90.4
25 tk, 0.2 sk, 2 prss, 0 INT, 0 FF
20.4
20 tk, 4.2 sk, 21 prss, 0 INT, 0 FF
32.4
15 tk, 0.3 sk, 2 prss, 1 INT, 0 FF
19.6
8 tk, 0 sk, 0 prss, 0 INT, 0 FF
7.5
5 tk, 0 sk, 0 prss, 0 INT, 0 FF
5.5
4 tk, 5.9 sk, 35 prss, 0 INT, 0 FF
33.4
J.R. Singleton DI
4 tk, 0 sk, 0 prss, 0 INT, 0 FF
4.5
Bubba Thomas DI
4 tk, 0 sk, 0 prss, 0 INT, 0 FF
4.5
2 tk, 0 sk, 0 prss, 0 INT, 0 FF
2.0
1 tk, 0 sk, 0 prss, 0 INT, 0 FF
1.0
1 tk, 0 sk, 0 prss, 0 INT, 0 FF
1.0
Special Teams FPTS
57 punts, 2651 yds
-
31/36 FG • 47/48 XP
134.0
59 KR, 1930 yds • 71 PR, 555 yds
130.4
No game data available.

Playoffs

Sun, Jan 17 1:00pm ET
1234 T
SEA logo SEA
10 3 3 0 16
DET logo DET
0 3 0 0 3
The Lions' season ends as the Seahawks win the Wild Card Round battle 16-3, advancing to the Divisional Round.
In the highest-stakes game of the year, the Seahawks showed what playoff football was about in the Wild Card Round. The offenses never found their rhythm in thi…
PASS Sam Darnold 15/21, 167 yds, 0 TD Sam Darnold 15/21, 167 yds, 0 TD
RUSH Zach Charbonnet 21 car, 71 yds, 0 TD Zach Charbonnet 21 car, 71 yds, 0 TD
REC Jaxon Smith-Njigba 4 rec, 61 yds, 0 TD Jaxon Smith-Njigba 4 rec, 61 yds, 0 TD
Sun, Jan 24 3:00pm ET
1234 T
SEA logo SEA
3 7 3 0 13
PHI logo PHI
0 0 0 7 7
The Seattle Seahawks road warriors proved their worth in the Divisional Round, stunning the Philadelphia Eagles 13-7, advancing to the Conference Championship.
The Seahawks made their stand in the Divisional Round and stood tall, advancing past the Birds in a win-or-go-home battle. Defensive football at its finest - th…
PASS Sam Darnold 16/26, 152 yds, 0 TD Sam Darnold 16/26, 152 yds, 0 TD
RUSH Zach Charbonnet 10 car, 51 yds, 0 TD Zach Charbonnet 10 car, 51 yds, 0 TD
REC Cooper Kupp 5 rec, 51 yds, 0 TD Cooper Kupp 5 rec, 51 yds, 0 TD
Sun, Jan 31 3:00pm ET
1234 T
SEA logo SEA
3 0 0 9 12
LAR logo LAR
10 21 3 10 44
A resounding playoff win: the Los Angeles Rams put the clamps on the Seattle Seahawks in the Conference Championship, 44-12, advancing to the Super Bowl.
At a rocking SoFi Stadium, in the highest-stakes game of the year, the Rams showed what playoff football was about in the Conference Championship. The first hal…
PASS Matthew Stafford 24/32, 253 yds, 4 TD Matthew Stafford 24/32, 253 yds, 4 TD
RUSH Kyren Williams 17 car, 72 yds, 1 TD Kyren Williams 17 car, 72 yds, 1 TD
REC Puka Nacua 8 rec, 75 yds, 2 TD Puka Nacua 8 rec, 75 yds, 2 TD
Playoff Team Stats
Points / Game 13.741 total
Total Yards / Game 254.7764 total
Pass Yards / Game 177.360.3% comp%
Rush Yards / Game 77.379 att
Playoff Roster Stats
Passing FPTS
47/78, 564 yds, 2 TD, 4 INT
23.5
Rushing FPTS
48 car, 157 yds, 0 TD
22.4
Jadarian Price HB
8 car, 26 yds, 0 TD
2.6
3 car, 13 yds, 0 TD
3.9
5 car, 12 yds, 1 TD
10.2
4 car, 9 yds, 0 TD
23.5
7 car, 8 yds, 0 TD
3.8
4 car, 7 yds, 0 TD
0.7
Receiving FPTS
12/19, 172 yds, 1 TD
35.2
8/12, 147 yds, 1 TD
28.7
12/21, 121 yds, 0 TD
24.1
4/8, 37 yds, 0 TD
7.7
4/5, 27 yds, 0 TD
22.4
1/1, 16 yds, 0 TD
3.9
1/1, 13 yds, 0 TD
2.3
Emmanuel Henderson Jr. WR
1/2, 11 yds, 0 TD
2.1
2/2, 10 yds, 0 TD
10.2
2/2, 10 yds, 0 TD
3.8
Lance Mason TE
0/1, 0 yds, 0 TD
-
0/3, 0 yds, 0 TD
-
0/1, 0 yds, 0 TD
-
Defense FPTS
25 tk, 0 sk, 0 prss, 0 INT, 0 FF
24.0
25 tk, 0 sk, 1 prss, 0 INT, 1 FF
27.5
24 tk, 0 sk, 3 prss, 0 INT, 0 FF
24.5
22 tk, 0 sk, 1 prss, 0 INT, 0 FF
22.5
21 tk, 0 sk, 0 prss, 0 INT, 1 FF
21.5
21 tk, 0 sk, 0 prss, 1 INT, 0 FF
22.5
Julian Neal CB
14 tk, 0 sk, 0 prss, 0 INT, 0 FF
13.0
13 tk, 1.5 sk, 12 prss, 0 INT, 0 FF
23.0
11 tk, 0 sk, 1 prss, 1 INT, 0 FF
17.5
9 tk, 1 sk, 10 prss, 0 INT, 0 FF
19.5
9 tk, 1 sk, 3 prss, 0 INT, 0 FF
11.5
8 tk, 1.5 sk, 9 prss, 0 INT, 0 FF
12.0
7 tk, 0 sk, 0 prss, 0 INT, 0 FF
6.5
5 tk, 0 sk, 0 prss, 0 INT, 0 FF
4.5
4 tk, 0 sk, 6 prss, 0 INT, 0 FF
5.0
3 tk, 0 sk, 0 prss, 0 INT, 0 FF
2.5
2 tk, 0 sk, 0 prss, 0 INT, 0 FF
2.0
2 tk, 0 sk, 0 prss, 1 INT, 1 FF
7.0
Bubba Thomas DI
1 tk, 0 sk, 0 prss, 0 INT, 0 FF
1.0
1 tk, 0 sk, 0 prss, 0 INT, 0 FF
1.0
Bud Clark S
1 tk, 0 sk, 0 prss, 0 INT, 0 FF
0.5
1 tk, 0 sk, 0 prss, 0 INT, 0 FF
2.0
Special Teams FPTS
12 punts, 566 yds
-
7/8 FG • 2/2 XP
22.0
8 KR, 258 yds • 8 PR, 28 yds
28.7
← Back to Season Projection