Jacksonville won in Cincinnati and has allowed 53 points in four games, and our model has the Jaguars at twelve wins with the third-best title odds in football
Updated
Jacksonville went to Cincinnati and won 22-17, its third win in four games, and the Jaguars have now allowed 53 points all season, the fewest in the league by 11. When we ran the rest of the season Jacksonville came out at 12-5 with a 97 percent playoff chance and a 15.5 percent title chance, up from 11.2 wins, 89.5 percent and 9.5 percent after Week 3. Only the Rams and Lions have better title odds. In July our model had the Jaguars at under ten wins and a four percent shot. The climb has been steady and it has been earned, one defensive performance at a time.
The defense is the best in the league by our numbers and has been for a month. Jacksonville projects to allow 256 points, the fewest in football, and the fourth-fewest yards. The Jaguars project for 15.5 interceptions, second in the league, and Foyesade Oluokun has two already and projects for four, with Jourdan Lewis at two and nearly three projected. Josh Hines-Allen projects for 15.4 sacks and Travon Walker for 10.6, which is the best edge pair in the conference. Ventrell Miller projects for 126 tackles. Jarrian Jones' tackle projection has climbed from 27 to 99 as the corner has taken on a full-time role. The team projects for 46 sacks, ninth. The unit held New England to six, Cleveland to ten and Cincinnati to 17, and the Denver loss in Week 2 was by a touchdown with the defense giving up 20.
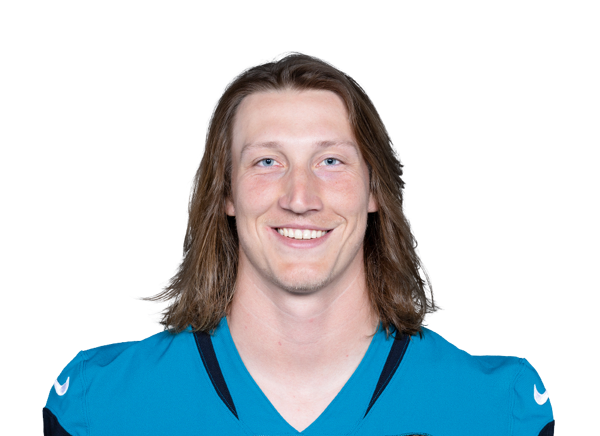
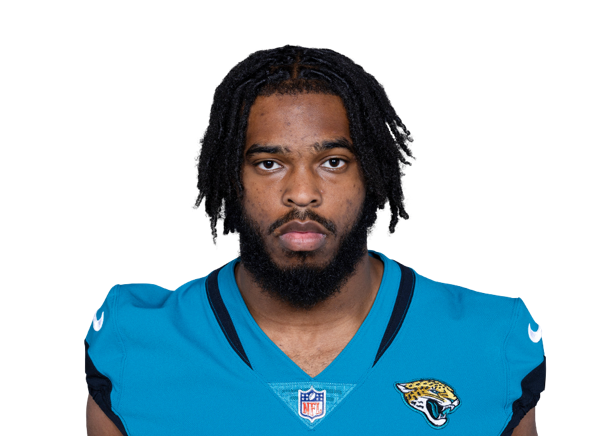
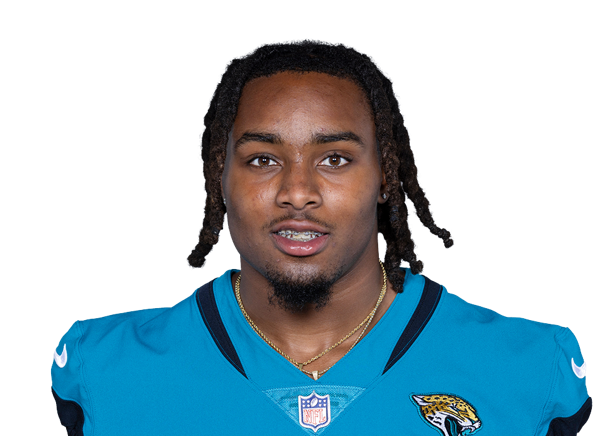
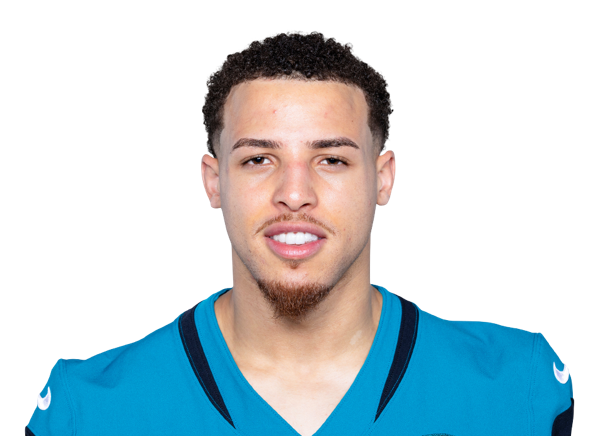
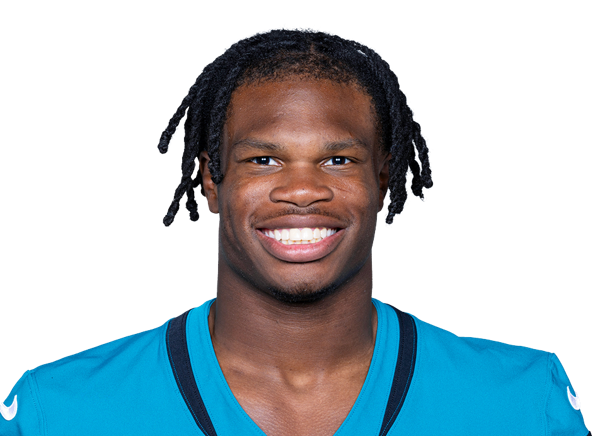
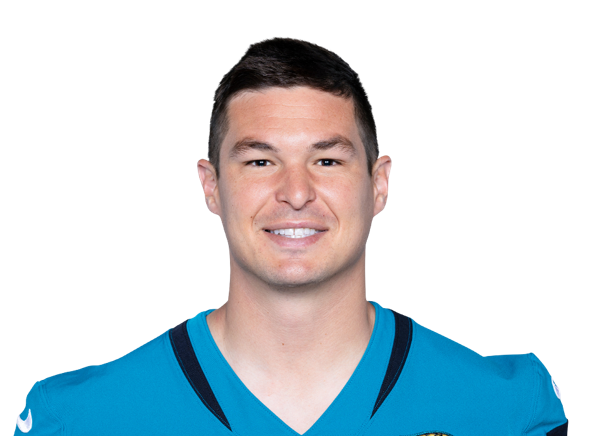
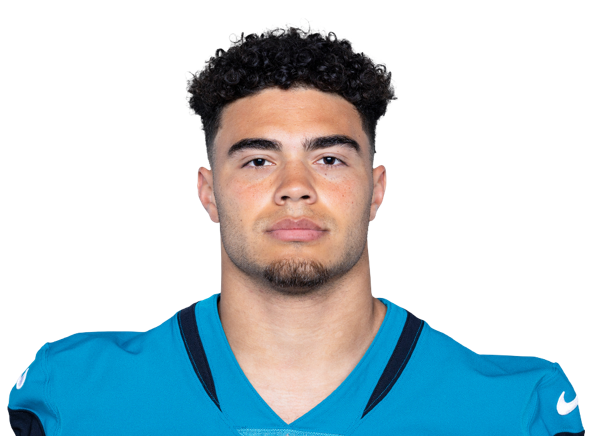
The offense has been efficient rather than explosive, and that has been enough. Trevor Lawrence is 72 of 104 for 843 yards with eight touchdowns and two interceptions, a 111 rating through four games, and projects for 3,950 yards and 28 touchdowns behind a rating near 105. Bhayshul Tuten has 277 rushing yards and projects for 1,031 and seven. Chris Rodriguez Jr. has two scores and projects for five. Parker Washington has 16 catches for 228 yards and two touchdowns and projects for 78 catches and 1,156 yards. Brenton Strange projects for 58 catches. Travis Hunter's receiving projection has more than tripled since last week, from twelve catches to 41, as his two-way role has tilted toward offense. The unit projects for 401 points, eighth in the league.
The division is close to settled by the model's reckoning. Houston is 0-4 and projects for eight wins with the head-to-head still to come twice. Indianapolis is 2-2 and projects for eight. Tennessee is 0-4 and projects for two and a half. Jacksonville has a three-game lead on the Texans and the Colts in the loss column and the best roster in the group, and when we ran the rest of the season the Jaguars won the AFC South in the large majority of simulated years. The Texans games are the only ones in the division the model treats as competitive.
The next month is where the title odds get tested. Philadelphia at home at 76 percent, Houston at home at 54, a bye in Week 7, Indianapolis at home at 80, and a trip to Baltimore at 54. When we ran that stretch the Jaguars went 3-1 more often than anything else, and 4-0 often enough that the twelve-win projection has room above it. The Baltimore game is the one the model treats as the AFC's best matchup before Thanksgiving, two top-three rosters with the division races already tilted their way.
The player lines are a roster the model keeps finding more in. Lawrence's projection dropped from 4,031 yards to 3,950 and from 29 touchdowns to 28, but his rating projection climbed from 102.6 to 104.6, which is fewer throws and better ones. Tuten's rushing projection rose from 916 to 1,031. Rodriguez's touchdown line went from three to five. Washington's projection slipped from 84 catches to 78. Strange's climbed from 52 to 58. Hunter's receiving projection went from twelve catches to 41 and from 131 yards to 460, the biggest move on the roster, while his tackle projection rose from eight to eleven. On defense, Hines-Allen's sack projection dropped from 16.4 to 15.4, Walker's from 11.4 to 10.6, and Oluokun's interception line climbed from 2.8 to four. Lewis' went from 1.8 to 2.8. Jarrian Jones' tackle projection went from 27 to 99. The number to watch is the points allowed. Jacksonville projects for 256, the fewest in the league, and has allowed 53 in four games, a pace under even that. The defense is the title case, and it has not had a bad week.
The matchup record has been clean. We gave Jacksonville 90 percent against Cleveland and the Jaguars won by 24. We gave them 68 in Denver and they lost by seven. We gave them 62 against New England and they won by 29. We gave them 52 in Cincinnati and they won by five. Three wins from about two and three-quarters expected is slightly ahead, and the Denver loss is the only result the model did not like. The market opened Jacksonville at nine wins. Our model sat on it in July, two over it after Week 3, and three over it now, which is the largest lean on the board after the Rams. The read is a top-three roster with the best defense in football and a quarterback playing the best ball of his career. The market has not caught up. The model has.