San Francisco is 4-0 and has still not allowed a sack, and our model holds the 49ers at ten wins with the Seattle game next
Updated
Four games, four wins, and a quarterback who has dropped back 113 times without being sacked once. That is where San Francisco sits after a 24-14 win over Denver, and it is a sentence that would have read like satire in July, when our model had the 49ers at six and a half wins and a defense it graded 30th. When we ran the rest of the season this week the 49ers came out at 10-7 with a 68 percent playoff chance, almost exactly where they sat after Week 3. The record projection has stopped climbing because the model has already priced in most of what the roster is showing. What has changed is the standings around it, and that is the part worth reading.
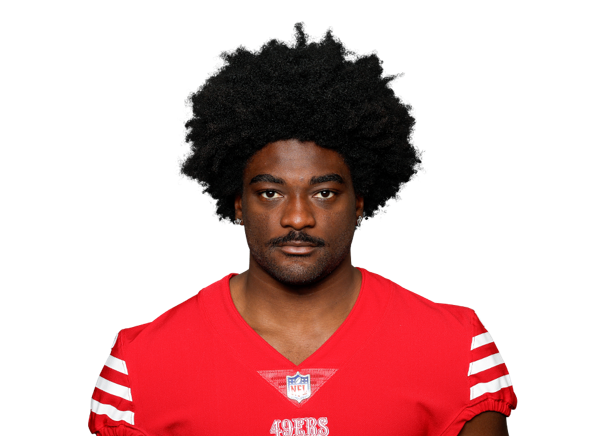
The offense remains the most efficient in football by the numbers that matter. Brock Purdy is 79 of 113 for 1,007 yards, eleven touchdowns and one interception, a passer rating of 126 through four games, and the sack column still reads zero. Our model projects him for 4,068 yards and 29 touchdowns behind a rating near 107, and the unit projects for 381 points, 13th in the league, which is a conservative number for an offense averaging 30 a game. Christian McCaffrey has four rushing scores and projects for 936 yards on the ground plus 64 catches. George Kittle has four touchdowns on 16 catches and projects for eight. Deebo Samuel has three scores. Mike Evans played through the rib injury against Denver, on about 60 percent of the snaps, and holds at 77 catches for 1,077 yards in the projection.
The defense held Denver to 14 without Nick Bosa, and that is the number our model has been waiting to see. The 49ers project to allow 331 points, tenth in the league, a long way from the 424 the summer sim had them giving up. Fred Warner projects for 126 tackles. Keion White projects for nine and a half sacks on the side Bosa is not occupying, and Bosa's own projection has drifted to just over eleven because of the games his calf is costing him. The team projects for 36 sacks, 25th in the league, which is the one soft number on the sheet. A pass rush that cannot get home against better quarterbacks than Bo Nix is the thing that will eventually be tested, and the schedule is about to test it.
The division has flipped in a month and the 49ers are the reason. Los Angeles is 2-2 after winning in Philadelphia, and the Rams still project for 13-4 and remain the title favorite in our numbers at 29 percent, but they are two games behind San Francisco and have already lost the head-to-head in Melbourne. Seattle is 3-1 and projects for ten wins, the same as the 49ers. When we ran the rest of the season the model still handed the NFC West to the Rams in most simulated years, because 13 projected wins beats ten, and the 49ers landed in a wild card spot more often than they won the division. A 4-0 start has earned San Francisco a playoff projection. It has not earned the division, and the model is clear about that.
The next month is where the lean gets decided. Seattle on the road at 36 percent this week, Washington at home at 78 with Jayden Daniels expected back for the Commanders, a trip to Atlanta at 34 against a Falcons team that just scored 45, and a bye in Week 8 before Las Vegas at home at 48. When we ran that stretch the 49ers went 2-2 more often than 3-1, and the two road games are the two the model gives to the other side. A 6-2 record entering November would push the projection past eleven. A 5-3 record would keep it at ten, which is where it has sat for two weeks.
The matchup record so far is the clearest case in the league of a model catching up to a team. We gave the 49ers ten percent in Melbourne, 66 against Miami, 72 against Arizona and 64 against Denver. They won all four, three of them comfortably, and the gap between four wins on the field and about two expected wins on paper is the whole story of why the projection has climbed three and a half wins since July. The model is not chasing San Francisco anymore. It has the 49ers as a ten-win playoff team with the most efficient quarterback in the conference, and the next two road games are where that gets confirmed or corrected.
The player lines that moved most in this run tell you where the model's attention is. Purdy's yardage projection slipped from 4,208 to 4,068 and his rating projection climbed from 105.7 to 106.5, which is the model expecting fewer attempts and better ones. McCaffrey's receiving projection dropped from 68 catches to 64 and his rushing line from 976 yards to 936, a small trim as Kaelon Black's role has held at 90 carries. Deebo Samuel's touchdown projection ticked up from four to five. On defense, Warner's tackle projection dropped from 133 to 126 and his interception line from nearly three to just over two, which is a change in how the model expects teams to attack the 49ers rather than a change in Warner. Bosa's line is the one to watch. It sat at twelve sacks a week ago and sits at 11.3 now, and every week he misses takes another half-sack off it. The model has the defense holding without him for now. It has not had to test that against a quarterback as good as Darnold or Mahomes yet.
The market opened San Francisco at ten wins. In July we sat more than three under it. We now sit a fraction over it, and the direction of the disagreement has reversed. The honest read is that the market bought the names in the summer and the model bought them in October, after a month of watching the whole roster play. Four wins in, with the quarterback untouched and the defense holding, the 49ers are a real team. Seattle this week is where we find out how real.