Detroit lost in Carolina as a 76 percent favorite, and our model has the Lions at 13-4 with the title odds up to 24 percent anyway
Updated
Detroit went to Carolina as the model's 76 percent favorite and lost 32-26, its second loss in four games, and the Lions are 2-2 with a defense that has given up 127 points. And yet the title odds went up. When we ran the rest of the season Detroit came out at 13-4 with a 98.5 percent playoff chance and a 24 percent title chance, up from 19 percent after Week 3 even as the record projection slid from 13.4 wins to 12.6. The two numbers moved in opposite directions for a reason that has little to do with Carolina: the Rams' title odds fell nine and a half points in the same run, and the Lions absorbed most of them. Detroit is the second-most likely champion in football. It is also 2-2 with a defense that has been a problem for a month.
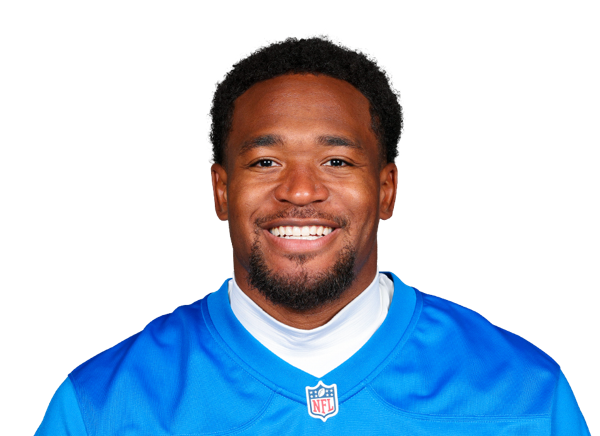
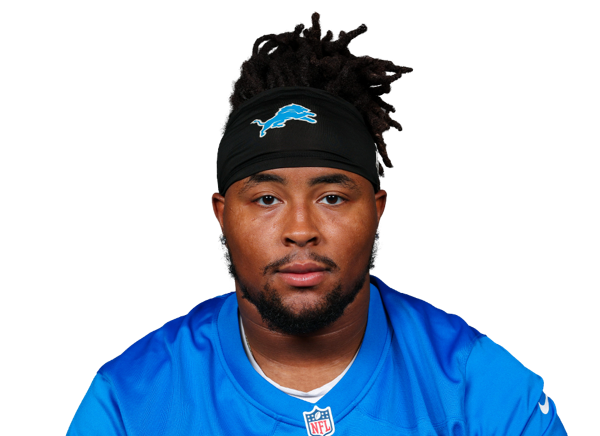
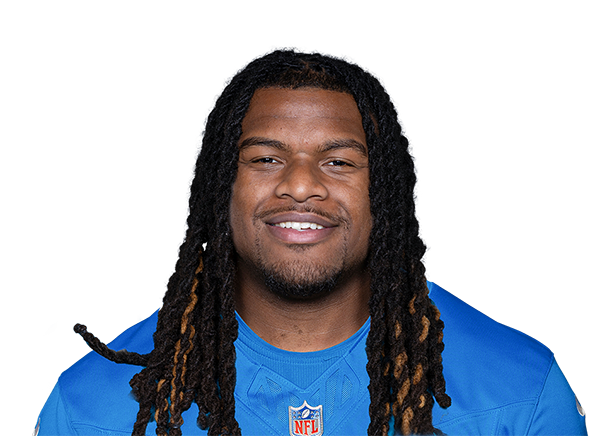
The offense is the best in the league and the model has no doubt about it. Detroit projects for 506 points, the most in football, and the second-most yards. Jared Goff is 109 of 161 for 1,214 yards with nine touchdowns and no interceptions, a 109 rating through four games, and projects for 4,672 yards and 36 touchdowns against four interceptions, which would be the best touchdown-to-interception season in league history if it held. Jahmyr Gibbs has 353 rushing yards and five scores plus 22 catches and two more, and projects for 1,396 rushing yards and 17 touchdowns. Amon-Ra St. Brown has 31 catches for 303 yards and five touchdowns and projects for 111 catches and eleven scores. Sam LaPorta projects for 79 catches and ten touchdowns. Jameson Williams for 68 catches. Isaac TeSlaa has emerged as a fourth option at 41 projected catches. Isiah Pacheco is on injured reserve with a back injury.
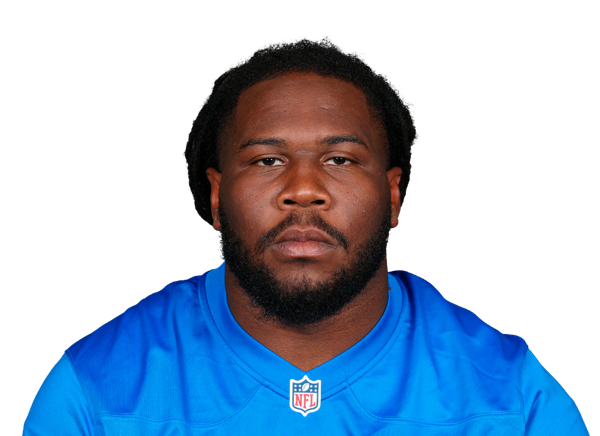
The defense is the reason the record is 2-2 and the reason the model's 13-4 is not 14-3. Detroit projects to allow 360 points, 18th in the league, up from 330 a week ago, and the Carolina game is where the extra 30 came from. The pass rush is the second-best in football by projection at 52 sacks. Aidan Hutchinson has four and projects for 17.5. Derrick Barnes projects for ten from linebacker. Alim McNeill has four sacks and projects for eight and a half from the interior. Brian Branch projects for nearly five interceptions. D.J. Reed projects for 102 tackles from corner, which is the number that tells you where the Panthers attacked. The unit has given up 41 to Buffalo and 32 to Carolina, and both were games the offense scored enough to win.
The division is Detroit's on paper and a race on the field. Minnesota is 4-0 and projects for nine wins. Chicago is 3-1 and projects for ten. Green Bay is 2-2 and projects for eight. The Lions are two games behind the Vikings and a game behind the Bears, and still project to finish with three more wins than either of them. When we ran the rest of the season Detroit won the NFC North in the large majority of simulated years, and the Vikings' 4-0 start held up in the minority. The gap is the roster, and the model sees it as the widest in any division.
The next month is where the record catches up to the projection. A trip to Arizona at 84 percent, a bye in Week 6, Green Bay at home at 82, Minnesota at home at 92, and a trip to Miami at 94. When we ran that stretch Detroit went 4-0 more often than any other outcome, and the four opponents include the two NFC North rivals the Lions are currently chasing. A 6-2 record entering November would put the Lions back on the 13-win pace and in front of the division.
The player lines are an offense that keeps getting better on paper and a defense that keeps costing it games. Goff's projection climbed from 4,312 yards to 4,672 and from 34 touchdowns to 36, with his interception line down from five to four and his rating projection up to 108.9. St. Brown's projection rose from 107 catches to 111. LaPorta's from 73 catches to 79 and from eight touchdowns to ten. Williams' from 66 catches to 68. TeSlaa's from 35 catches to 41. Gibbs' rushing projection dropped from 1,543 to 1,396 and his touchdown line from 19 to 17, which is the model trimming the ground game as the passing game absorbs more. Vaki's rushing projection slipped from 307 to 293 with the groin. On defense, Hutchinson's sack projection fell from 19 to 17.5, Barnes' from 11.3 to 10.1, and McNeill's rose from 8.1 to 8.5. Branch's interception line dropped from 4.8 to 4.6. Clark's tackle projection climbed from 74 to 86. The number to watch is the points allowed. Detroit projects for 360, up from 330 a week ago and from 273 in July. The offense can carry 360. It cannot carry 400, and two road losses have pushed the number halfway there.
The matchup record is a team that has lost the two games it was not supposed to lose. We gave Detroit 82 percent against New Orleans and the Lions won by one. We gave them 74 in Buffalo and they lost by ten. We gave them 68 against the Jets and they won by seven. We gave them 76 in Carolina and they lost by six. Two wins from three expected is a full win behind, and both losses were road games against teams the model had well below the Lions. The market opened Detroit at twelve wins. Our model sat a win over it in July and sits a half-win over it now. The lean is the offense, and it is the best in the league. The hedge is a defense that has given up 32 to Carolina and has the Bills and Panthers on its record, and the model has started to price that in.