Minnesota is 4-0 having allowed 51 points, and our model holds the Vikings at nine wins because the offense is the question
Updated
Minnesota beat Miami 15-10 at home and is 4-0, the only unbeaten team in the NFC North and one of three in the league. The Vikings have allowed 51 points in four games, the fewest in football, and have scored 86, which is the middle of the league. That is the whole season in two numbers, and the model's reaction to it has been consistent. When we ran the rest of the season Minnesota came out at 9-8 with a 37.5 percent playoff chance, up a fraction from 8.9 wins after Week 3 and two and a half wins above the 6.5 the summer sim projected. A 4-0 team projected for nine wins is the model telling you it has watched the Vikings win four games by a combined 35 points and does not expect the margin to hold.
The defense is as good as the record. Minnesota projects to allow 337 points, eleventh in the league, which is a conservative number for a unit on pace for well under 250, and the pass rush is the third-best in football by projection at 50.6 sacks. Dallas Turner has six sacks in four games and projects for 17, the second-highest individual projection in the league. Andrew Van Ginkel has four sacks and an interception and projects for nine and a half. Eric Wilson has three sacks. Blake Cashman's tackle projection has jumped from 36 to 120 as the linebacker has returned to a full role. Isaiah Rodgers, James Pierre and Byron Murphy Jr. all project for between one and two interceptions, and the team projects for under ten picks, 21st, which is the one number on the defensive sheet that is not elite. The unit has held Green Bay, Chicago, Tampa Bay and Miami to a combined 51 points, and the Bears and Dolphins scored 13 between them.
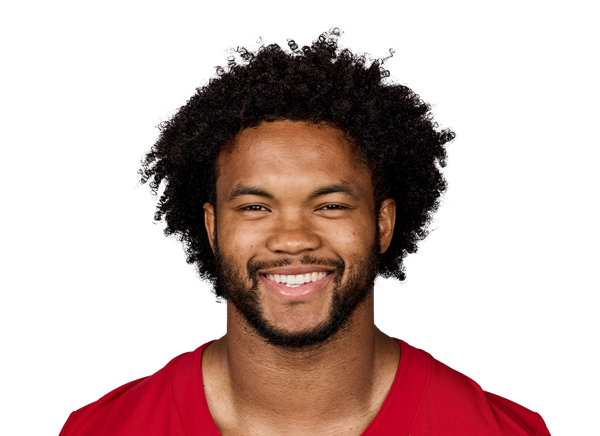
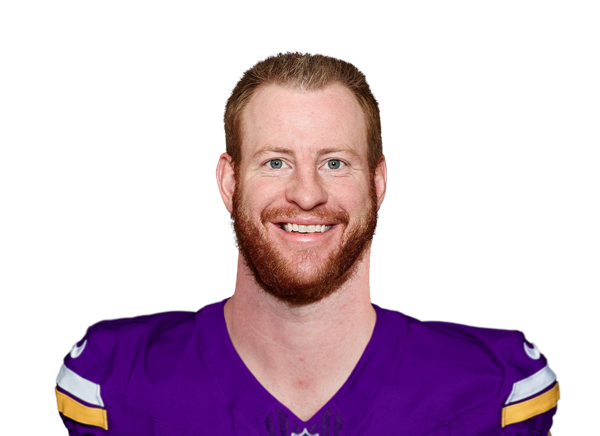
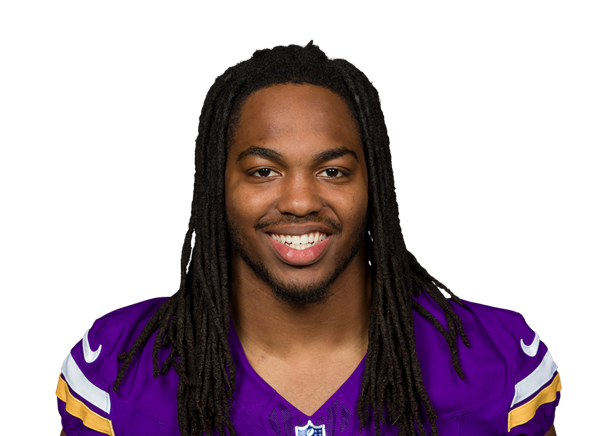
The offense is why the projection stops at nine. Kyler Murray has started three of the four games and is 45 of 71 for 433 yards with one touchdown and two interceptions, a 73 rating, with Carson Wentz filling in for the other. Our model projects Murray for 3,188 yards and 14 touchdowns, which is a quarterback the model does not trust to win a shootout. Justin Jefferson has 13 catches for 179 yards and two touchdowns in three games, missed the Miami game with an ankle injury, and is hopeful for Sunday. He projects for 74 catches and 974 yards, the lowest projection of his career. T.J. Hockenson has 22 catches and projects for 62. Aaron Jones has 297 rushing yards and projects for 858. Jordan Mason is on injured reserve with a thumb injury and is eligible to return in Week 7. The unit projects for 334 points, 21st in the league, and the 27th-most yards.
The division is where the record matters most and the model is least impressed. Detroit is 2-2 and projects for 13 wins with a 24 percent title chance. Chicago is 3-1 and projects for ten, with the head-to-head already lost to Minnesota. Green Bay is 2-2 and projects for eight. The Vikings lead the NFC North by two games over the Lions and project to finish four wins behind them. When we ran the rest of the season Minnesota won the division in a minority of simulated years and finished second or third far more often, and the two Detroit games are where the gap was made.
The next month is where the model's skepticism gets tested. A trip to New Orleans at 62 percent, a bye in Week 6, Indianapolis at home at 54, a trip to Detroit at eight, and Buffalo at home at 56. When we ran that stretch Minnesota went 2-2 more often than anything else, with the Detroit game treated as a loss in nearly every simulated year. A 6-2 record entering November would push the projection toward ten and force the model to take the defense more seriously than it already does.
The player lines are a defense the model keeps upgrading and an offense it keeps holding flat. Murray's projection climbed from 3,090 yards to 3,188 while his touchdown line dropped from 16 to 14 and his interception projection from ten to nine. Wentz's held near 340 yards. Jefferson's projection fell from 78 catches to 74 and from 1,040 yards to 974 with the ankle. Hockenson's climbed from 46 catches to 62, the biggest move on the roster. Addison's rose from 49 catches to 52. Jennings' dropped from 52 to 48. Jones' rushing projection rose from 815 to 858. Mason's fell from 212 yards to 174 with the thumb. On defense, Turner's sack projection climbed from 15.9 to 17.2, Van Ginkel's dropped from ten to 9.6, and Cashman's tackle projection went from 36 to 120. Rodgers' and Pierre's interception lines held near two. The number to watch is the points scored. Minnesota projects for 334, 21st in the league, and has scored 86 in four games, which is a pace for 365. The model is below the pace. If the offense holds at 21 a game with this defense, nine wins is two or three too few.
The matchup record is the largest overperformance in the league after Cleveland. We gave Minnesota 36 percent against Green Bay and the Vikings won by 17. We gave them 32 in Chicago and they won 9-3. We gave them 48 in Tampa Bay and they won by seven. We gave them 74 against Miami and they won by five. Four wins from under two expected is the gap, and the first three were games the model had the other side winning. The market opened Minnesota at eight and a half wins. Our model sat two under it in July and sits a half-win over it now. The lean is the pass rush, which is real. The hedge is an offense that has scored 15, nine and 23 in three of its four wins, and the model has priced that offense at nine wins rather than the defense at twelve.