Tennessee is 0-4 and lost by six in Baltimore, and our model has the Titans at two and a half wins with the lowest-scoring offense in football
Updated
Tennessee went to Baltimore and lost 24-18, its closest result of the season, and fell to 0-4. The Titans have lost by 13, four, five and six, which is a team that is in games and not winning them, and the model's view has not changed since the summer. When we ran the rest of the season Tennessee came out at 3-14 with no playoff chance, averaging two and a half wins, which is a fraction below where it sat after Week 3 and a win and a half below the 3.9 we projected in July. Only Miami projects for fewer wins.
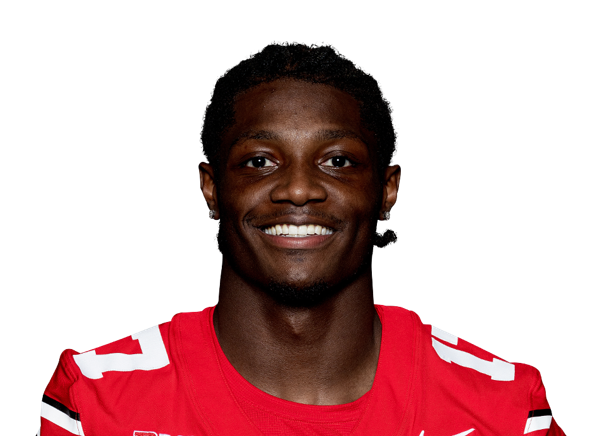
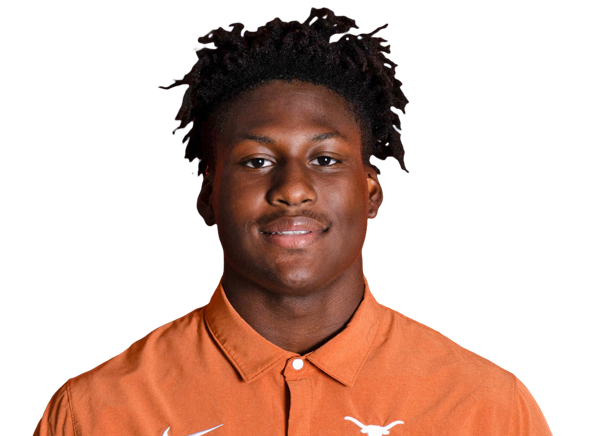
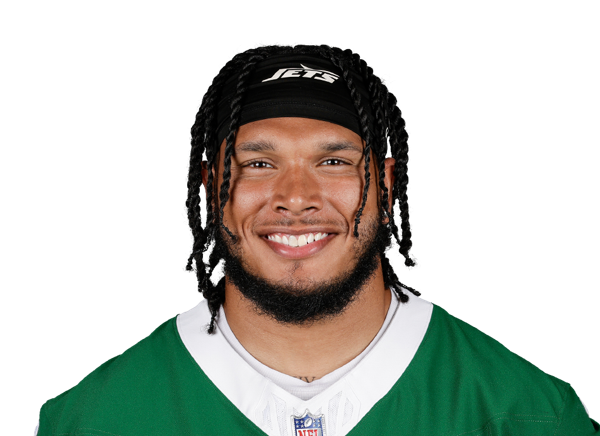
The offense is the lowest-scoring in the league by projection and by result. Tennessee has scored 55 points in four games, and our model projects 220 for the season, 32nd in the league, with the fewest yards in football. Cam Ward is 75 of 119 for 728 yards with three touchdowns and two interceptions, an 81.5 rating, and projects for 3,531 yards and 13 touchdowns. The yardage projection has climbed 150 in a week, which is the model noticing that the Baltimore game was his best. Carnell Tate has 22 catches for 268 yards without a touchdown and projects for 94 catches and 1,150 yards, up from 90 and 995. Wan'Dale Robinson has two scores and projects for 67 catches. Tony Pollard has 221 rushing yards and projects for 589. Tyjae Spears is questionable with an ankle. The offensive line has given up six sacks, which is the one number on the sheet that is not bad.
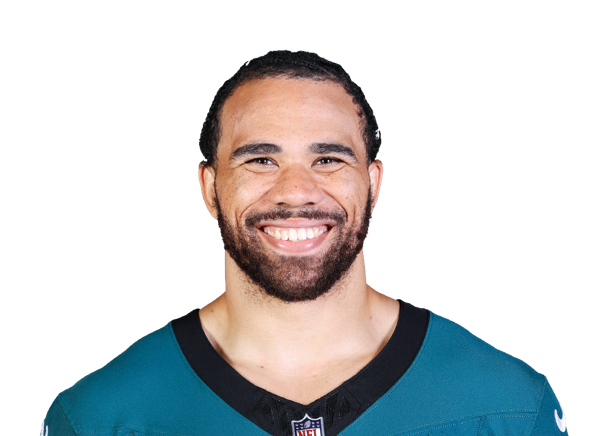
The defense has been competitive and the numbers say so. Tennessee projects to allow 389 points, 25th in the league, and has given up 83 in four games, which is a pace well under that projection. Jeffery Simmons projects for nine sacks and John Franklin-Myers for nearly seven from the interior, which is where the Titans' front is strongest. The edge is the problem. Jacob Martin projects for four and a half sacks as the leading edge rusher, and the team projects for under 34 sacks, 31st in football. Amani Hooker and Kevin Winston Jr. project for 87 and 89 tackles from safety. Marcus Harris projects for a sack and a half and nearly two interceptions from corner. The unit kept the Ravens to 24 and the Giants to 12. It is not the reason the Titans are 0-4.
The division has two teams at 0-4 and the Titans are the one the model believes is 0-4. Jacksonville is 3-1 and projects for twelve wins. Houston is 0-4 and projects for eight. Indianapolis is 2-2 and projects for eight. When we ran the rest of the season Tennessee finished last in the AFC South in nearly every simulated year, and the Houston game this week, which the model gives the Titans an 18 percent chance of winning, is the one division game it treats as anything other than a loss.
The next month is where the two and a half wins will come from if they come at all. Houston at home at 18 percent, a trip to Indianapolis at 24, Cleveland at home at 54, a trip to Cincinnati at 16, and a bye in Week 9. When we ran that stretch Tennessee went 1-3 more often than 0-4, and the Cleveland game is the first one all season the model has the Titans favored in. A 1-7 record entering November would put the projection on schedule.
The player lines are an offense being rerun around a rookie receiver. Ward's projection climbed from 3,386 yards to 3,531 and from twelve touchdowns to 13, with his rating projection up from 81.7 to 84.1. Tate's projection rose from 90 catches to 94 and from 995 yards to 1,150, the largest receiving move on the roster. Robinson's touchdown line went from three to four. Ayomanor and Helm held near 37 and 46 catches. Pollard's rushing projection held at 589 while his touchdown line doubled to four. Spears' dropped from 263 yards to 251 with the ankle. On defense, Simmons' sack projection slipped from 9.3 to nine and Franklin-Myers' from 7.4 to 6.7, while Jacob Martin's climbed from 3.7 to 4.4. Marcus Harris' sack line went from near zero to over one and his interception projection held near two. Taylor's tackle projection fell from 98 to 91. The number to watch is the points scored. Tennessee has 55 in four games and projects for 220, which is a 12.7-point average from here. The model has the Titans scoring less than any team in football, and nothing in four weeks has argued otherwise.
The matchup record is a team that has lost close games it was supposed to lose. We gave Tennessee 24 percent against the Jets and the Titans lost by 13. We gave them ten against Philadelphia and they lost by four. We gave them 46 in New York and they lost by five. We gave them 16 in Baltimore and they lost by six. Zero wins from about one expected win is a small underperformance, and the Giants game is the one that should have gone the other way. The market opened Tennessee at five and a half wins. Our model sat a win and a half under it in July and sits three under it now. The lean is about an offense that has scored 55 points in a month and a quarterback the model has not seen enough from to move. The defense has been better than the record. It is a long way from enough.