Atlanta scored 45 in New Orleans with Bijan Robinson at 145 yards, and our model moved the Falcons to eleven wins and five percent title odds
Updated
Atlanta went to New Orleans on Monday night and won 45-24, scoring five rushing touchdowns, and the Falcons are 2-2 with the third-best offense in football by our projection. That is a different team from the one that scored 16 points in its first two games with Cooper Rush at quarterback, and the model has noticed. When we ran the rest of the season Atlanta came out at 11-6 with an 85 percent playoff chance and a five percent title chance, up from 9.7 wins, 67 percent and two percent after Week 3. The projection is now back to the eleven wins the summer sim had for the Falcons, and the two games since Michael Penix Jr. returned are the reason.
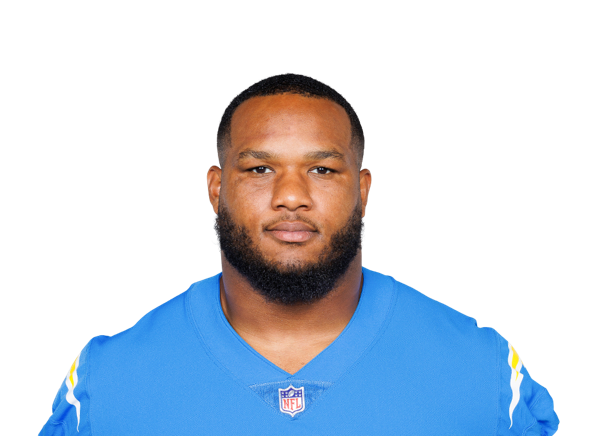
The offense with Penix is the offense the model projected in July. He is 33 of 45 for 479 yards with two touchdowns and an interception in his two starts, a 113 rating, and went 15 of 20 for 233 yards against the Saints. Atlanta has scored 80 points and gained over 900 yards in his two games. Our model projects him for 3,221 yards and 18 touchdowns across the games it expects him to play, behind a 99 rating, up from 94 a week ago. Bijan Robinson has 494 rushing yards and four touchdowns, ran for 145 and two scores in New Orleans, and projects for 1,956 rushing yards and 19 touchdowns, the highest rushing projection in the league by 250 yards. Brian Robinson has four rushing touchdowns, three of them on Monday, and projects for 690 yards and ten. Drake London has 20 catches for 370 yards and projects for 101 catches and 1,426 yards. Kyle Pitts projects for 47 catches. The unit projects for 439 points, third in the league, up from 393 and tenth.
The defense is the hedge, and the model has not moved on it. Atlanta projects to allow 353 points, 15th in the league, and the 15th-fewest yards. Samson Ebukam projects for nearly nine sacks, Za'Darius Smith for eight after three in four games, and Cameron Thomas for over seven. The team projects for 41 sacks, 16th, and under nine interceptions, 28th, which is the number that keeps the Falcons' defense in the middle rather than the top. Xavier Watts projects for 93 tackles and nearly three interceptions. Divine Deablo for 92 stops. The unit gave up 34 to Carolina in Week 2 and 24 to the Saints, and the model has it as a unit that gives up points but not games. Jake Matthews left the Saints game eleven snaps in, and the left tackle's status is the first thing to check this week.
The division is open and the Falcons are the model's pick to win it. Carolina is 2-2 and projects for nine wins, with the head-to-head already won by the Panthers in that 34-3 game. New Orleans is 1-3 and projects for six. Tampa Bay is 0-4 and projects for three. When we ran the rest of the season Atlanta won the NFC South more often than any other team by a wide margin, and the Carolina rematch in December is the only division game the model treats as a toss-up.
The next month is the hardest stretch of the schedule and it arrives with the offense at full strength. Baltimore at home at 46 percent, Chicago at home at 72, San Francisco at home at 66, a trip to Tampa Bay at 86, and Cincinnati at home at 62. When we ran that stretch Atlanta went 4-1 more often than anything else, and the Ravens game is the only one the model treats as a loss more often than a win. A 6-3 record entering November would push the projection past eleven and the title odds toward double figures.
The player lines are an offense the model has rerun around its real quarterback. Penix's projection dropped from 3,239 yards to 3,221 with his rating projection up from 94.4 to 99, which is the model expecting fewer throws and better ones, and Rush's remaining line is the 229 yards and four interceptions he already has. Bijan Robinson's rushing projection climbed from 1,771 to 1,956 and his touchdown line from 17 to 19, the biggest move on the roster. Brian Robinson's rushing projection rose from 599 to 690 and his touchdown line from six to ten. London's projection slipped from 105 catches to 101. Pitts' climbed from 46 catches to 47 and Dotson's yardage rose from 503 to 541. On defense, Ebukam's sack projection rose from 8.5 to 8.7, Smith's dropped from 8.3 to 7.9, and Thomas' climbed from 6.2 to 7.3. Watts' sack line went from near zero to over one while his interception projection fell from 3.2 to 2.7. Deablo's tackle projection dropped from 95 to 92. The number to watch is the points scored. Atlanta projects for 439, third in the league, and that assumes Penix starts every remaining game. He has started two. The model has priced the rest.
The matchup record is a team that has lost the games it was favored in with Rush and won the ones it was favored in with Penix. We gave Atlanta 54 percent in Pittsburgh and the Falcons lost by seven. We gave them 82 against Carolina and they lost by 31. We gave them 60 in Green Bay and they won by 21. We gave them 66 in New Orleans and they won by 21. Two wins from about two and two-thirds expected is under the projection, and both misses were with the backup. The market opened Atlanta at nine wins. Our model sat two over it in July, under a win over it after Week 3, and two over it again now. The lean is the quarterback and the running back, and the two games they have played together are the best two games any NFC South offense has produced this season.