Indianapolis won in London with Jonathan Taylor at six touchdowns, and our model holds the Colts at eight wins with the passing game the problem
Updated
Indianapolis beat Washington 30-13 in London, its second straight win after an 0-2 start, and sits at 2-2. The win came the way the Colts' wins come: Jonathan Taylor ran, the defense held a backup quarterback down, and Daniel Jones did not have to do much. When we ran the rest of the season Indianapolis came out at 8-9 with an 18 percent playoff chance, which is exactly where it sat after Week 3 and three wins below the 10.8 we projected in July. The model has stopped moving on the Colts. It has watched a team win two games on the ground and the defense and sees no reason to believe the passing game will join in.
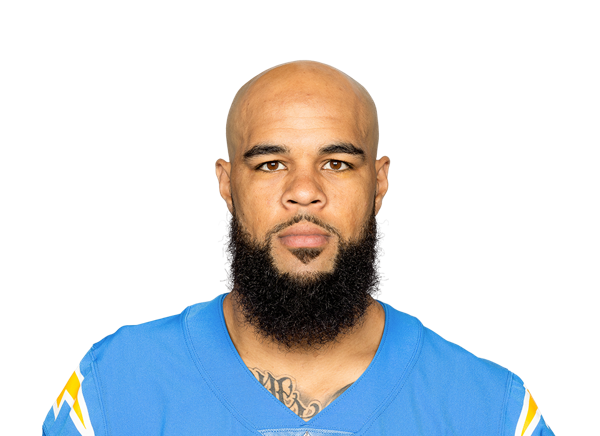
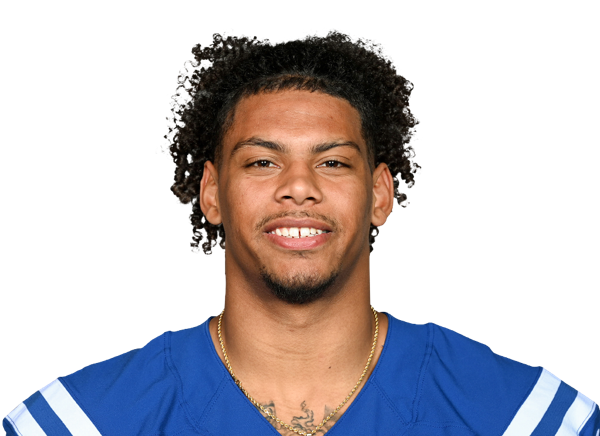
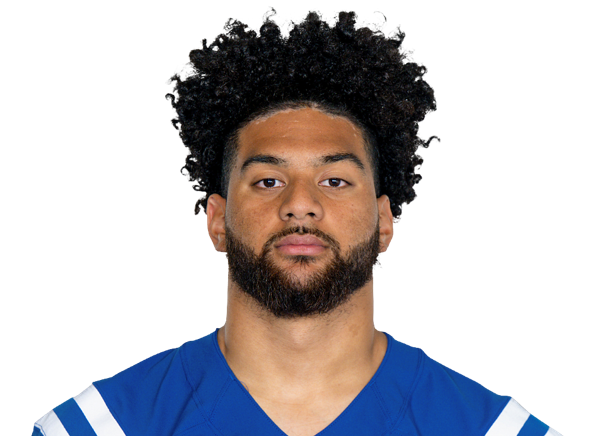
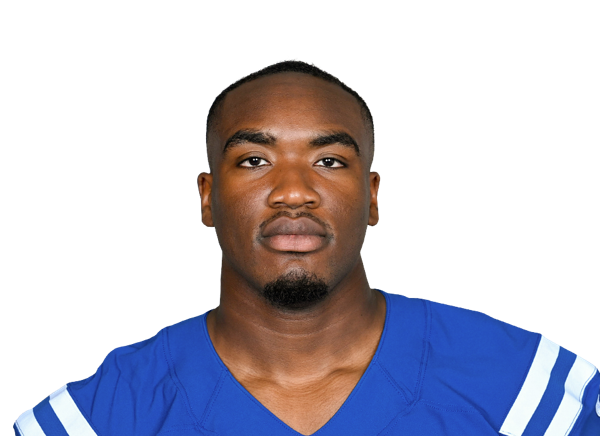
The running back is the offense. Taylor has 353 rushing yards and six touchdowns on 86 carries and projects for 1,208 yards and 13 scores, the second-highest rushing touchdown projection in the league. Seth McGowan's projection has grown to 284 yards in a secondary role. The passing game is the issue and it is a quarterback issue. Daniel Jones is 84 of 132 for 754 yards with three touchdowns and four interceptions, a 74 rating through four games, and our model projects him for 3,747 yards, 19 touchdowns and 14 interceptions. Tyler Warren has 23 catches and two scores and projects for 88 catches, the most on the team. Josh Downs has 202 yards and projects for 82 catches. Keenan Allen missed London with a groin injury, Alec Pierce is on injured reserve with a heel, and Laquon Treadwell's projection has jumped from 13 catches to 49 as a result. The unit projects for 369 points, 16th in the league.
The defense has been better than the grade and the model has started to notice. Indianapolis projects to allow 386 points, 24th in the league, which is still a harsh number for a unit that has given up 30 to Kansas City and 13 to Washington in consecutive weeks. DeForest Buckner has five sacks in four games. Adetomiwa Adebawore projects for nearly ten, Laiatu Latu for nine and a half, and Arden Key for nine. The team projects for 44 sacks, eleventh in football. The weakness is in the air. The Colts project for seven interceptions, the fewest in the league, and Camryn Bynum's 105-tackle projection is the sign of a secondary that is tackling after the catch rather than before it.
The division has a clear leader and the Colts are not it. Jacksonville is 3-1 and projects for twelve wins with the third-best title odds in the league. Houston is 0-4 and projects for eight, the same as Indianapolis, with the head-to-head already lost to the Colts. Tennessee is 0-4 and projects for two and a half. When we ran the rest of the season Indianapolis finished second in the AFC South more often than any other spot, which is the model telling you the Texans' record is misleading and the Colts' is not.
The next month is a mix. A trip to Pittsburgh at 30 percent, Tennessee at home at 76, a trip to Minnesota at 46, a trip to Jacksonville at 20, and Dallas at home at 36. When we ran that stretch the Colts went 2-3 more often than anything else, with the Tennessee game the only one the model treats as safe. A 4-5 record entering November would keep the eight-win projection on schedule and the wild card race in view, which is about as much as the Colts can ask from a quarterback with three touchdown passes.
The player lines are a running back the model keeps trusting and a quarterback it does not. Jones' projection dropped from 3,861 yards to 3,747 and from 20 touchdowns to 19, with his interception line up from 13 to 14 and his rating projection down from 89.5 to 86.9. Taylor's rushing projection slipped from 1,227 to 1,208 while his touchdown line held at 13. McGowan's rushing projection climbed from 197 to 284. Downs' projection dropped from 88 catches to 82 and Allen's from 65 to 59 with the groin. Warren's climbed from 84 catches to 88. Treadwell's went from 13 to 49. On defense, Adebawore's sack projection rose from 7.5 to 9.7, the biggest move on the roster, Key's dropped from ten to 8.9, and Justin Walley's sack line went from near zero to over one. Bynum's tackle projection fell from 113 to 105. The number to watch is the interceptions. Indianapolis projects for 7.4, the fewest in the league, and a defense that cannot take the ball away is a defense that has to hold up for 60 minutes every week.
The matchup record is a team that has won the games it was expected to win and lost the ones it was not. We gave Indianapolis 70 percent against Baltimore and the Colts lost by 18. We gave them 52 in Kansas City and they lost by three. We gave them 44 against Houston and they won by two. We gave them 72 in London and they won by 17. Two wins from about two and a third expected is close to even, and the Baltimore game is the one that was supposed to go differently. The market opened Indianapolis at nine wins. Our model sat nearly two over it in July and sits a win under it now. The lean is about a quarterback the model has downgraded every week since September and a running back it keeps upgrading, and eight wins is where those two trends meet.