

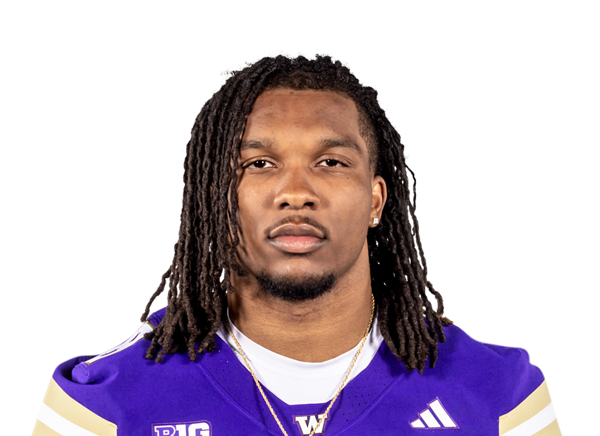
Rylon Dillard-Allen S Washington |
NFL Draft Profile & Scouting Report
| Jersey: #18 ROLE: Man-Zone Slot/Nickel Safety | ||||||||||||||||||||||||
| Last Updated: 06/03/2026 | ||||||||||||||||||||||||
| Draft Year: 2028 | ||||||||||||||||||||||||
| FORTY time: 4.28 seconds (100%*) | ||||||||||||||||||||||||
|
||||||||||||||||||||||||
| Jersey: #18 | |
| ROLE: Man-Zone Slot/Nickel Safety | |
| Last Updated: 06/03/2026 | |
| Draft Year: 2028 | |
| Forty time: 4.28 seconds (100%*) | |
| Overall Rating: |
85.0 / 100
|
|
|---|---|---|
| Average rating of opposition Offense player has faced | ||
| Offense Rating: |
|
73% |
| Click the links below to view how player ranks vs other prospects. | ||
| Tackling: |
|
85% |
| Run Defense: |
|
59% |
| Coverage: |
|
85% |
| Zone: |
|
83% |
| Man/Press: |
|
81% |
|
DRAFT PROJECTION:
1st - Mid
Overall Rank:
#19
Position rank:
#7 (DB)
|
||
| College Games: 13 College Snaps: 377 | ||
 ESPN RATING: 82/100
|
||
|
247 RATING: 93/100
|
||
 RIVALS RATING: 5.7 (93%)
|
||
| Player Comparison* (Similarity level) | ||
|---|---|---|
| Kamari Ramsey - USC |
|
81% |
| Brandon Joseph - Notre Dame |
|
72% |
| Renardo Green - Florida State |
|
72% |
How other scouting services rate Rylon Dillard-Allen (Overall Rank)
All Scouts AverageOverall Rank
88.0
All Scouts AveragePosition Rank
18.0
*Percentile Ranking in Player's Position Group (NFL Combine Historical Data): This percentile reflects how a player's specific statistics rank
in comparison to historical performances at the NFL Combine, specifically within their position group. A higher percentile indicates a better performance.
For instance, being in the 90th percentile for a particular stat means the player outperformed 90% of their peers in that category.
*Similarity Percentage: This percentage is calculated based on a comprehensive analysis of various factors, including height, weight, 40-yard dash times, on-field performance statistics, and overall player rating. The analysis is conducted against our database of draft prospects from 2021 to 2023. This similarity score helps in evaluating how closely a current prospect aligns with past prospects. It is important to note, however, that this score reflects similarities based on college production and attributes, and does not account for eventual success or performance in the NFL.
*Similarity Percentage: This percentage is calculated based on a comprehensive analysis of various factors, including height, weight, 40-yard dash times, on-field performance statistics, and overall player rating. The analysis is conducted against our database of draft prospects from 2021 to 2023. This similarity score helps in evaluating how closely a current prospect aligns with past prospects. It is important to note, however, that this score reflects similarities based on college production and attributes, and does not account for eventual success or performance in the NFL.